

Model Attribute and Column Selections
Once data sets or tables have been selected in the previous stage of modeling, the user needs to choose the columns or 'attributes' that will be used to drive the analysis in data Discovery. These attributes are used to create 'hierarchies' and in some cases the metrics or measures that will be used.
Attributes can be used directly; they can be used in creating other calculated attributes; they can be used to generate measures; used in creating calculated measures; and, used as sort columns for other attributes.
Using and Selecting Attributes and Columns
The column/attribute selection panel is used to drive how data set attributes are going to be used and deployed.

Column Types and Name
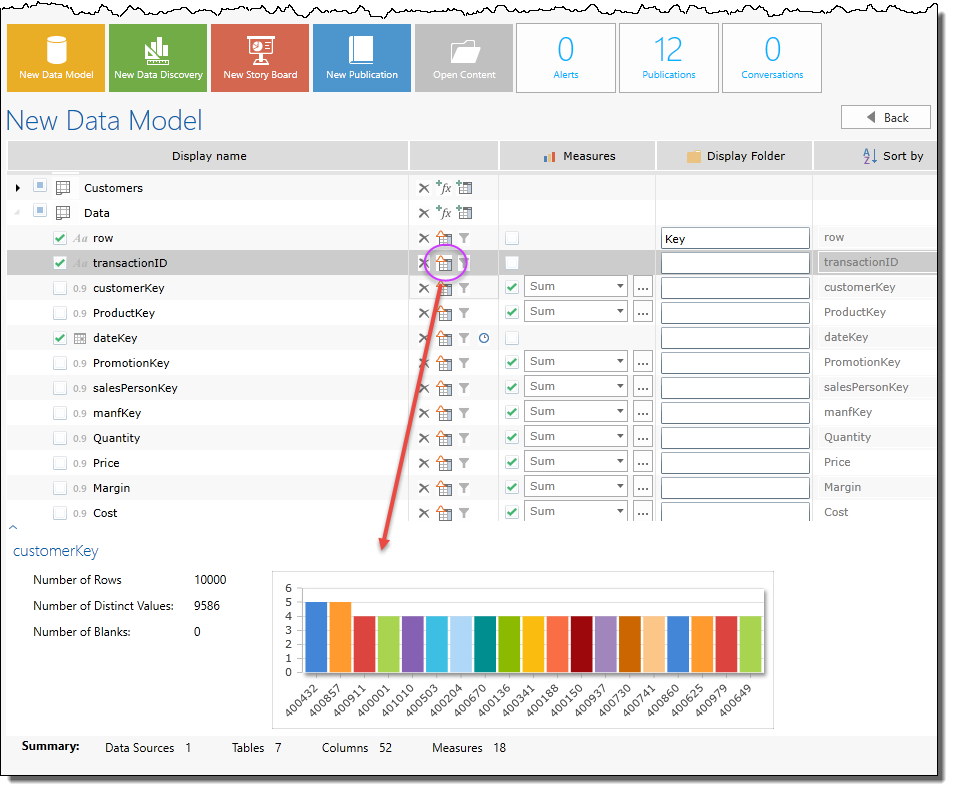
The first field in the column selector panel (red arrow above) shows each of the attributes or columns within each data set.
The data type of each column, determined heuristically, is shown next to the column's name (orange highlight). The iconic key for data types is:
-
“123” means an integer or whole number
- “0.9” means a decimal or “floating” number
- A calendar means date or time
- “Aa” means text
Hidden Columns
You can elect to keep a column in the data model by checking its selector (black highlight) or hide it from view. A hidden column is not shown as an attribute in the final model, but can be used as a source for other functions like calculated columns, measures or user hierarchies. Usually, columns used for metrics are hidden. As such, the BI Office modeling heuristic will hide all auto-set measure columns.
IMPORTANT : A hidden column is not to be confused with a DELETED column. Deleted columns are removed completely from the model (yellow highlight above). This can make a model lighter and faster - but they cannot be used as a source for any other functionality. Removing unneeded columns is a useful exercise when appropriate.
Context Menus
Right clicking on a column label in the first field will show the a different context menu for renaming, deleting, filtering and splitting columns. See here for more on column operations.
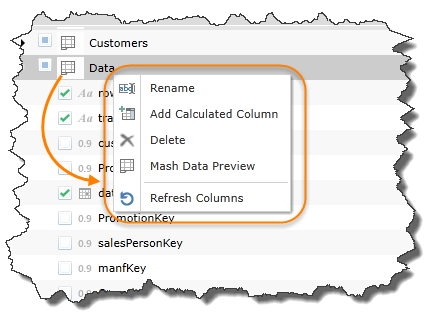
Right clicking on a data set item in the first field will allow you to rename the data set/table (which ultimately becomes the dimension); add new calculated columns; delete the data set; get a preview of the table's data and refresh the column listing (see orange highlight below in snippet image).
Column Actions
The second field in the column selector (purple arrow above in the main image) presents several mini-buttons with table and column related actions:
Table Actions
There are 3 table actions (blue highlight above)
- Delete - to remove the data set from the model (the same functionality is also available in the previous data set selection stage)
- Add custom measure - allows the user to add a new custom/calculated measure to the dimension and the model. See here for more.
- Add calculated column - allows the user to add a new calculated column/attribute to the model.See here for more.
Column Actions
There are up to 4 column actions (green highlight above)
- Delete - to remove the column (permanently) from the model. This is the same as the delete function in the context menu. See here for more.
- Column Statistics - this shows a panel below the column selector with an overview of the column's data. See below.
- Filter - this provides a column level filter where users can limit the data imported into the model from the source. See data filtering for more.
- Time Intelligence - this will activate the time intelligence logic for this column - automatically producing the related time intelligence calculated columns and hierarchies. See below.
Measures
The third field in the selector allows users to set measures using column values (yellow arrow in the main image above).
To set a column into a measure click the check box (purple highlight above) and then choose a measure aggregation type of the drop down box. Depending on the column data type, different drop down aggregation options will be available. Clicking the ellipsis button will provide more options for measures.
NOTE: a column does not need to be visible to be used as a measure. In fact, columns used for measures should not be visible in the model. As such, the heuristics in BI Office that auto select which columns to be used as measures will generally also makes the same column invisible in the model by default.
Click here for more on measures, metrics and calculated measures.
Display Folder
The “Display Folder” field (black arrow above) allows users to set a folder name for the column. The display is an organizational and grouping mechanism to make it easier for users to navigate the model structure in Data Discovery.
Sorting
Often, the need arises to sort the values of one column using the values of another column. Using the “Sort By” drop downs (blue arrow above), you can make the necessary sort selections for each column. By default, each column is sorted by its own values.
NOTE: the sort list for any column is limited to the other columns in the same data set.
Categorization
“Category” allows users to set a logical type for the column. The types can be used to activate different functionality in the application:
- Geospatial analytics and visualizations are enabled if the column types are set to Address, City, Continent, Country, County, Postal Code or State.
- The grid image functions are available for Image and Image URL
Column Statistics
Clicking on the column statistics button (purple highlight below) will activate the statistics viewer (red arrow below). This will give an overview of the columns contents, showing:
- total rows of the column
- number of distinct values in the column
- number of blank values
- a histogram of the data types found in the column and their frequencies
Time Intelligence
If the data set includes a date/time column, the user can elect to build time intelligence into the model by checking the “Time Intel” option. This powerful feature determines all the necessary calculations and setting for creating date time analytics based on that specific column.
The option creates extra logical columns of information (new analytic attributes) and places them into a separate time intelligence display folder.
NOTE: You can create this intelligence for more than one date time field per model.
Home |
Table of Contents |
Index |
User Community
Pyramid Analytics © 2011-2022